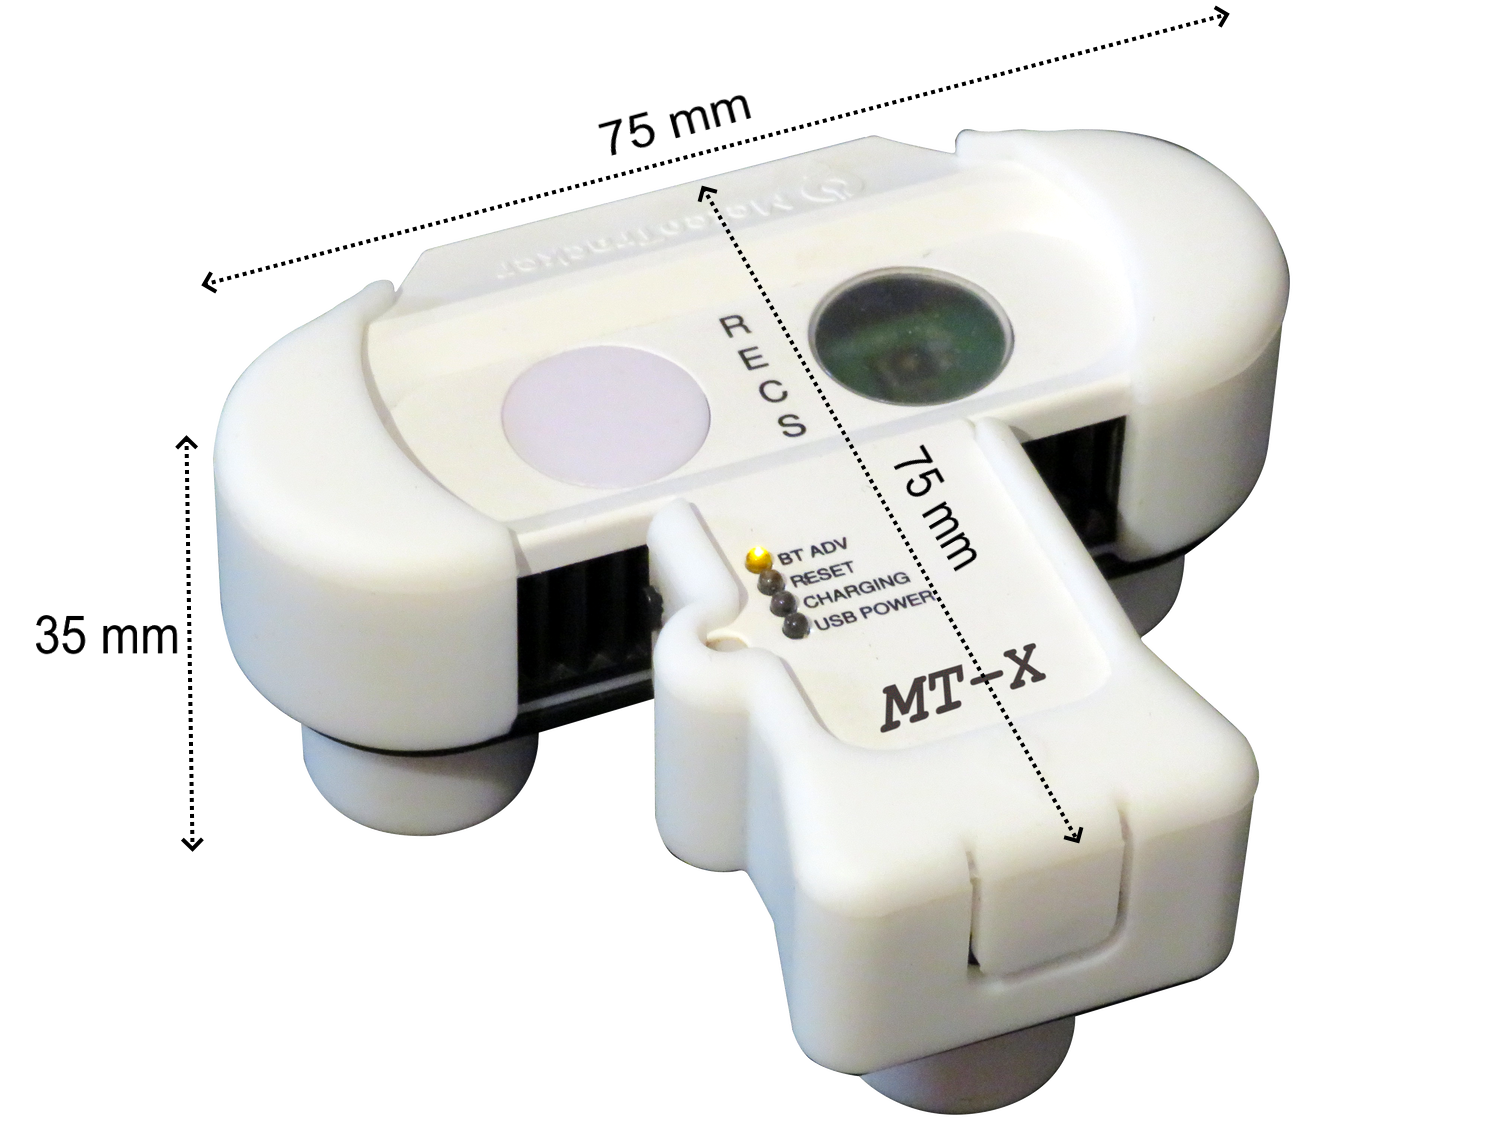
MeteoTracker is the first weather device that allows weather enthusiasts to enter the unprecedented and surprising dynamic dimension of meteorological measurements, overcoming the traditional static approach.
With MeteoTracker and its patented technology, weather observations become dynamic, allowing us to detect and accurately measure many atmospheric phenomena that fixed weather station networks fail to observe, turning meteorology into the scientific field that fascinates us so much: extreme thermal inversions, phoen/stau effect, urban heat island, impact of vegetation cover, breeze influence and many other hyper-local phenomenon strictly related to the soil characteristics and orography that only a mobile approach to weather observations allow you to detect and measure.
With MeteoTracker every trip will become a fascinating weather exploration.
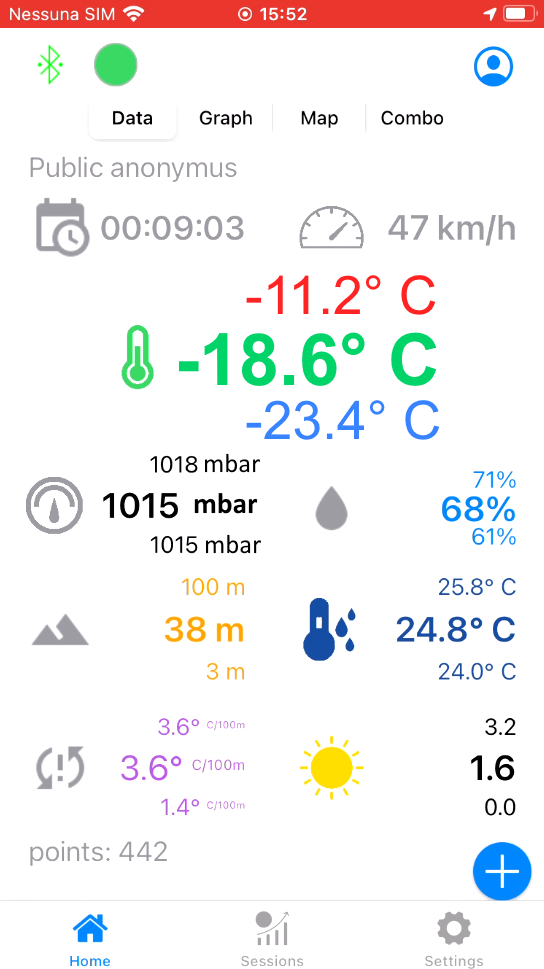
The MeteoTracker App (Android and iOS) allows for real-time visualisation, sharing and cloud upload of the data collected, creating a detailed archive of your measurements sessions. Each weather-trip can be analysed by graphs and statistic data and the 9 measured and geo-tagged parameters exported on CSV file in a very easy way.
The MeteoTracker dashboard provide a rich set of real-time visualisation and analysis tools in addition to a detailed archive of your measurement sessions, that can be easily exported in CSV format.
Weather measurements on the move at high spatial resolution allows us to detect and quantify the most interesting weather phenomenon, getting an unprecedented weather knowledge totally out of reach of the fixed station network.
THERMAL INVERSION

Thermal inversion is a well-known phenomenon, but only by using mobile measurements with high spatial resolution does it become clear that data provided by fixed stations is just the tip of the iceberg. This phenomenon can generate records of extreme temperature variations over very short distances.
With MeteoTracker we have measured a difference of up to 10.4 °C across 200 m, or 15.3° over less than 3 km!
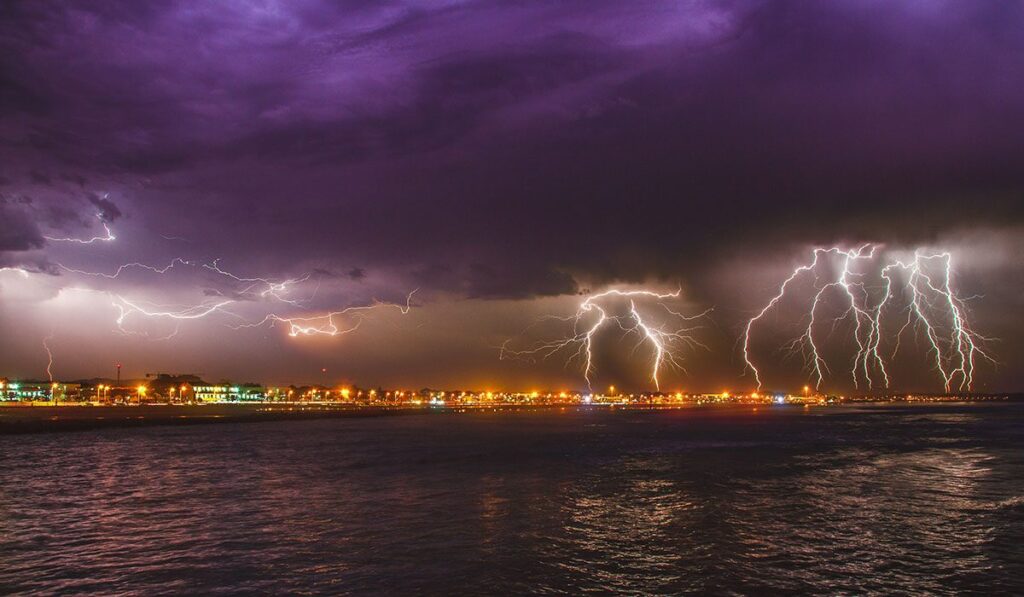
STORM CHASING

If you are passionate about storm chasing, with MeteoTracker you can monitor meteorological parameters that underlie extreme weather events with greater accuracy and high spatial resolution. It is then possible to view your data on a map along with the data gathered by other active MeteoTrackers around you.
URBAN HEAT ISLANDS AND THE IMPACT OF PUBLIC GREEN AREAS
If you move around within an urban area and your means of transport turns into a travelling weather station, each trip will become an interesting collection of data that is useful for measuring the impact of the urban fabric on the microclimate.
The MeteoTracker community is gradually building a database that shows how crucial public green areas are for appeasing the summer heat, the detrimental effect of extensive areas of land covered by concrete and asphalt.
This provides valuable information for urban planning that is more oriented towards improving the quality of life in cities.
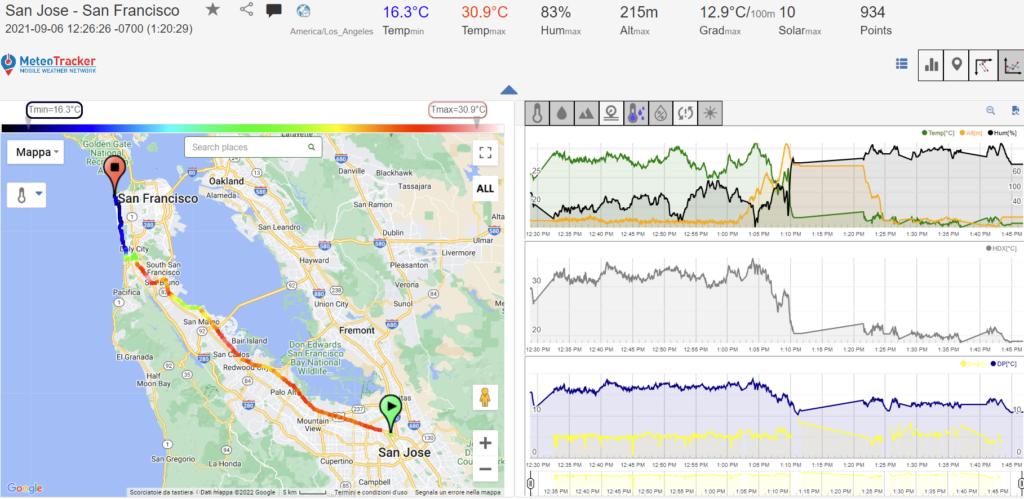
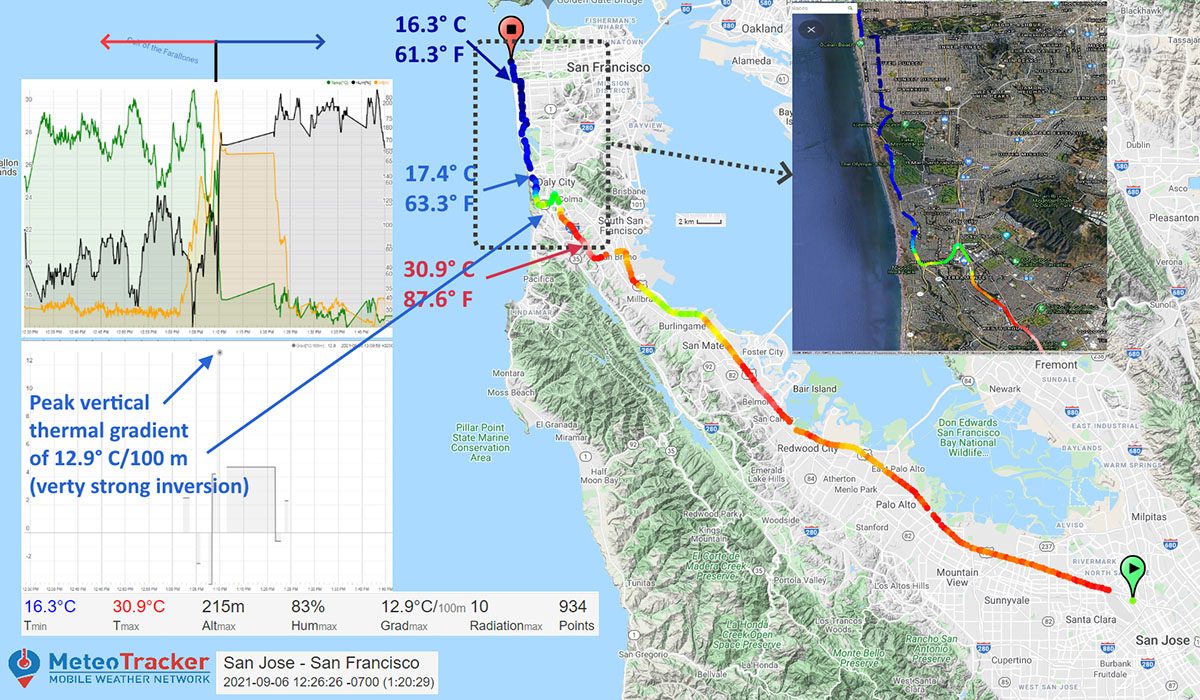
THE EFFECT OF BREEZES
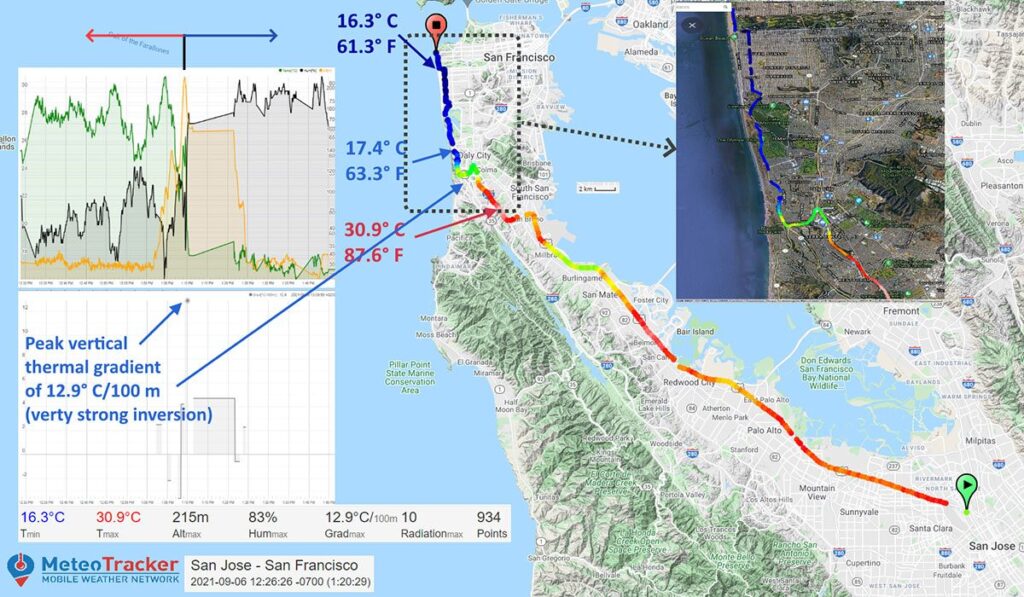
From 16 °C to 32 °C. This is not the temperature difference between summer and winter in some Mediterranean city.
These are values that can be measured at the same time in a location that is exposed to winds generated by the temperature difference between the sea (or a lake) and the mainland. As in the case of a MeteoTracker session in the California Peninsula (desktop optimised visualization).
The mobile hygrometric-thermal high resolution scan allow us to accurately measure the impact of breezes and with MeteoTracker you can create your own personal archive of measurements that you can use to map out their extent and intensity exactly.
THE STAU AND FOEHN EFFECT
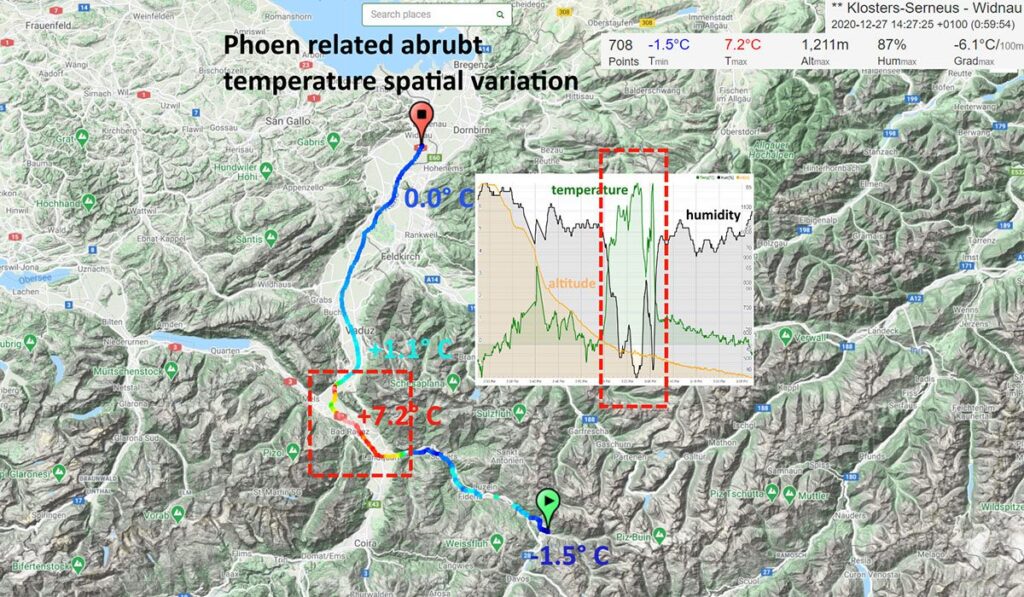
Snow and cold on one side. Dry and mild on the other.
When the winds hit the mountains, the thermodynamic state of the atmosphere does not do things by halves.
The variations in temperature and humidity can be so sharp that the measurements taken on the move can be astonishing.
MeteoTracker allows you to trace the thermo-hygrometric profile of valleys and mountainsides and accurately quantify – in terms of degrees, relative humidity, the vertical thermal gradient and spatial extent – the two opposing wind regimes.
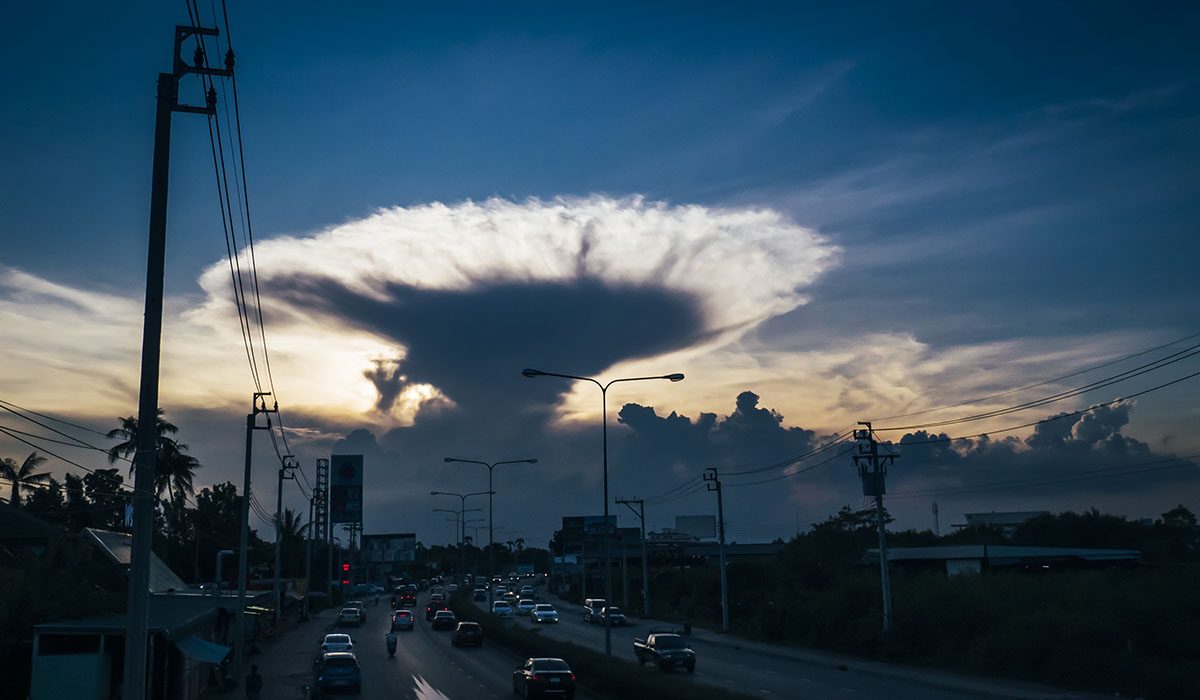
ATMOSPHERIC INSTABILITY
A storm is an extraordinary heat engine ruled by extremely complex phenomena.
To predict its development and intensity is a challenge that is yet to be solved, though there are indicators that are very useful for understanding its energy potential.
One of these is the change in temperature as altitude varies.
The MeteoTracker App acquires the data from the mini-station, processes it and calculates this parameter, referred to as the vertical thermal gradient (the vertical component of the temperature gradient, to be more precise).
FREE FLIGHT
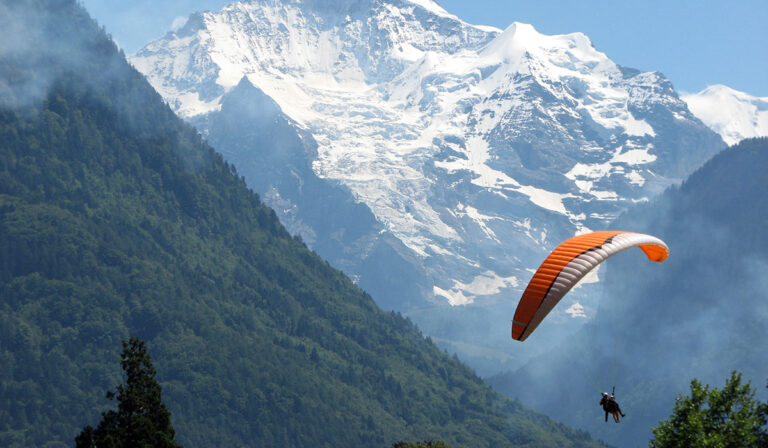
Free flight is one of those contexts in which, more than in others, the method for recording thermo-hygrometric data on the move may lead to an important innovation, in terms of analysing and monitoring the thermal quality of the flight area.
As a matter of fact, by recording the thermo-hygrometric profile, it is possible to assess the existence and intensity of ascending or descending motions in the atmosphere.
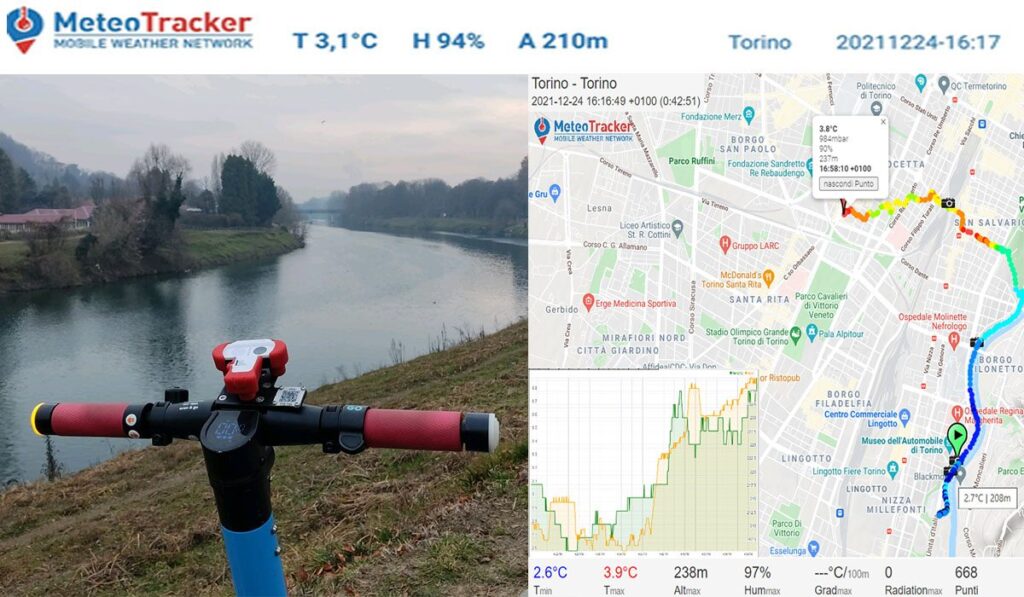
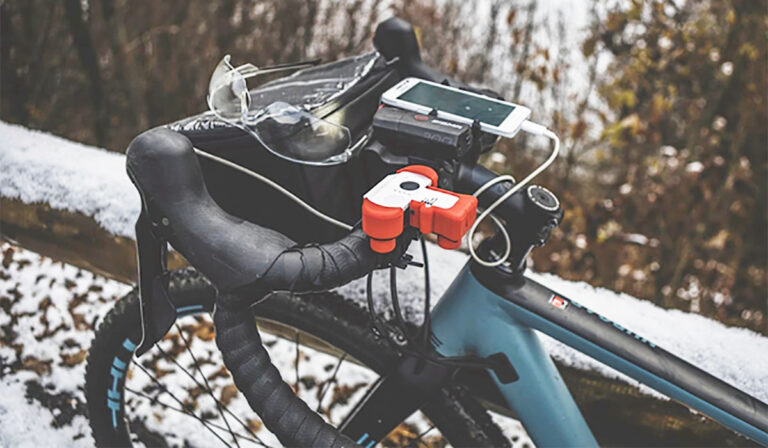
BIKING
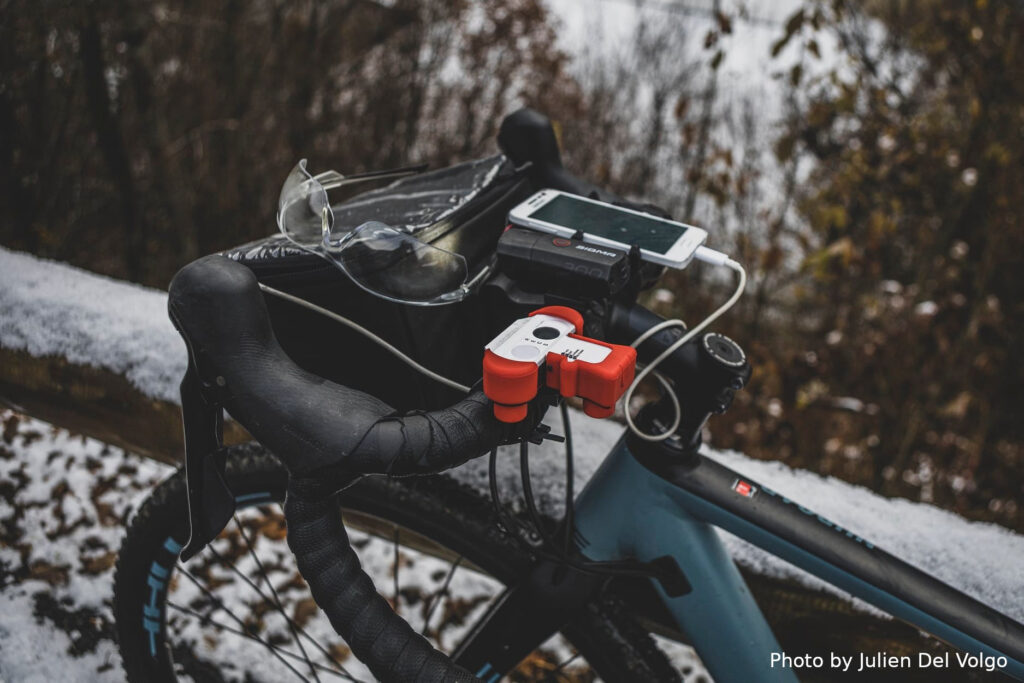
Our practical bike-holder allows you to install MeteoTracker on any type of bicycle – or other means equipped with a handlebar – to monitor rapid temperature variations during your trips and explore unique microclimates that cannot easily be reached by other means and other weather stations.
Plus, each bike ride will be archived in your MeteoTracker dashboard where you can keep track of all your cycling trips and the relative weather conditions.
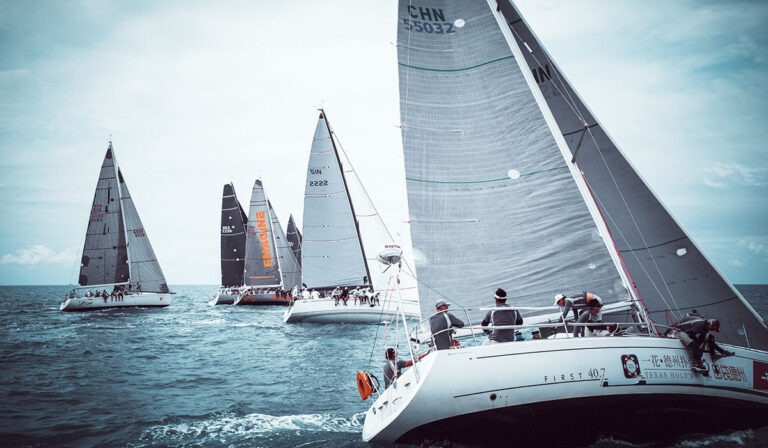
BOATING

Thanks to its portability, MeteoTracker is the ideal weather station to take on board large and small boats.
The real-time display of weather data on a map and the graphs showing the barometric pressure trends on your smartphone help you predict incoming changes in the weather.
SPORT
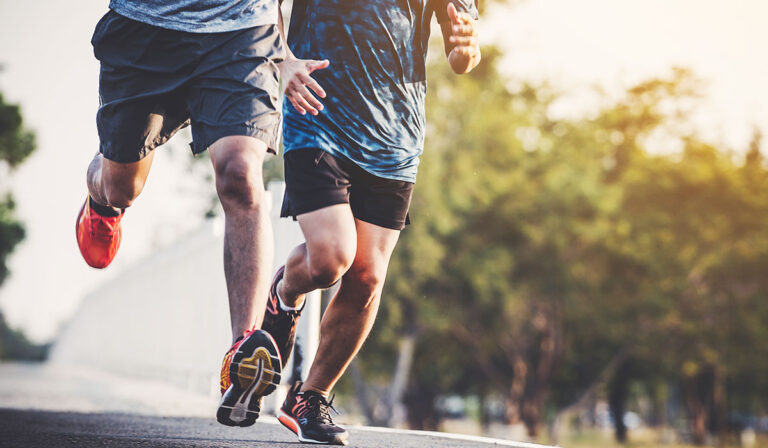
Monitoring environmental conditions during sporting activities is extremely important for those who practice sports.
With MeteoTracker you can view the temperature, relative humidity, heat stress index, dew point temperature, altitude and other parameters that impact your performance and your progress. You can view these in real-time on your smartphone and geo-tag your data along your entire route.
Each training session or race will become a MeteoTracker session that you can then find in your dashboard.
HIKING
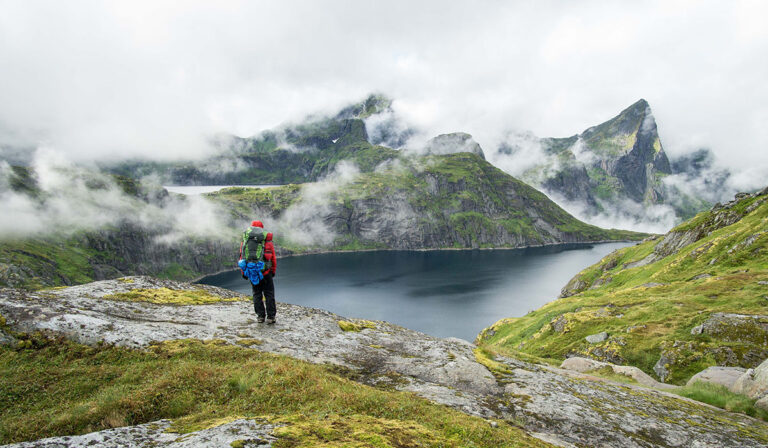
The weather can change very rapidly when you are hiking, especially in the mountains.
As MeteoTracker monitors temperature, pressure and dew point instantaneously, you can predict changes in weather conditions throughout your trip.
You can also explore and map out unique microclimatic conditions in remote locations, where no-one has ever recorded meteorological parameters before.
SKIING

You can attach the MeteoTracker to your ski poles using the bike-holder and collect unprecedented meteorological data with a spatial resolution of few meters as you move down the slopes. Here is an example from a Sella Ronda MeteoTracker session (visualization optmized for desktop).
MONITORING INDOOR ENVIRONMENT

From the comfort of your smartphone, you can use MeteoTracker to monitor temperature and humidity in the various rooms of your home.
You can also monitor your fridge or freezer, verifying the proper storage of your food through the time-series temperature graphs available in the MeteoTracker App.