The MeteoTracker map module is a custom map for visualizing in an easy and comprehensive way the dynamic weather observations coming from the MeteoTracker units belonging to a given organization or from a given geographical area.
It can be instantly embedded in every web site.
Scroll-down menus allow the selection of the parameter to be displayed (among the 8 variables available) on the map and the time interval of interest (real-time, last 1, 3, 12 and 24 hours).
By clicking on a weatherpoint (represented by a circle), all the parameters measured in that point are shown, together with the link that opens (on the MeteoTracker dashboard) the session from which that weatherpoint comes from, allowing a detailed analysis of it.
CONTACT US if you are interested in having your own MeteoTracker map!
MAIN FEATURES:
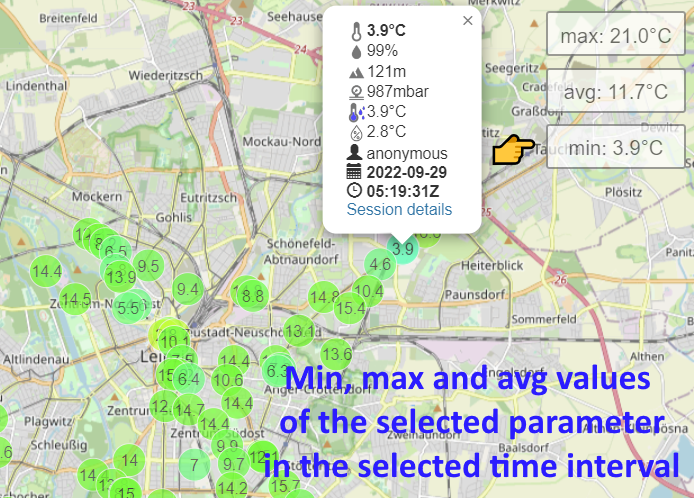
- by clicking on a marker (circle), a small pop up is opened with all the data measured in that point
- by clicking on “Session details”, the session from which that weatherpoint comes is opened on the MeteoTracker dashboard, where it can be analyzed in detail (graph, statistics, CSV data export, etc…)
-
the first scroll-down menu in the top-left corner allows to select the parameter to be shown on the map among those measured by MeteoTracker (temperature, humidity, pressure, altitude, dew-point, vertical thermal gradient, humidex, solar radiation intensity indicator)

- the second scroll-down menù in the top-left corner allows to select the time-interval of interest (real-time, last 1, 3, 12 and 24 hours).

-
the minimum, average and maximum values of the selected parameters for the selected time interval are visualized in the top-right corner.
By clicking on the min or max value, the corresponding marker on the map is highlighted and all the parameters associated to it displayed

- instant integration on third-party web site (i-frame)
For example: https://meteorologiehautnah.github.io/MeteorologieHautnah/