What’s the temperature?
Will it be cold where we’re heading?
Where was the coldest place last night?
A quick look on the internet or at the screensaver of your smartphone would provide you with what would appear to be answers to these questions.
But is that really the temperature value that awaits us just outside of our homes, or in the place we’re travelling towards?
No, it isn’t. Or at least, it is in no way a given that it will be.
Let’s see why.
The data that comes from a fixed weather station network is generally accurate and reliable. Less so, the data we see on the screensaver of our smartphones, this is often due to interpolation as we seek to compensate for the lack of weather stations in specific locations.
But this is not the point.
No matter how accurate and reliable the temperature data may be, during certain common meteorological situations, the data derived from a fixed weather stationwill never be able to provide an exact representation of the thermal distribution across a reference geographical area.
For reasons well-known to meteorological experts – air temperature often hasvery notable spatial variabilityand the data measured at one specific point may be very different to that measured at a distance of several hundred metres, sometimes just tens of metres away.
SOME DATA
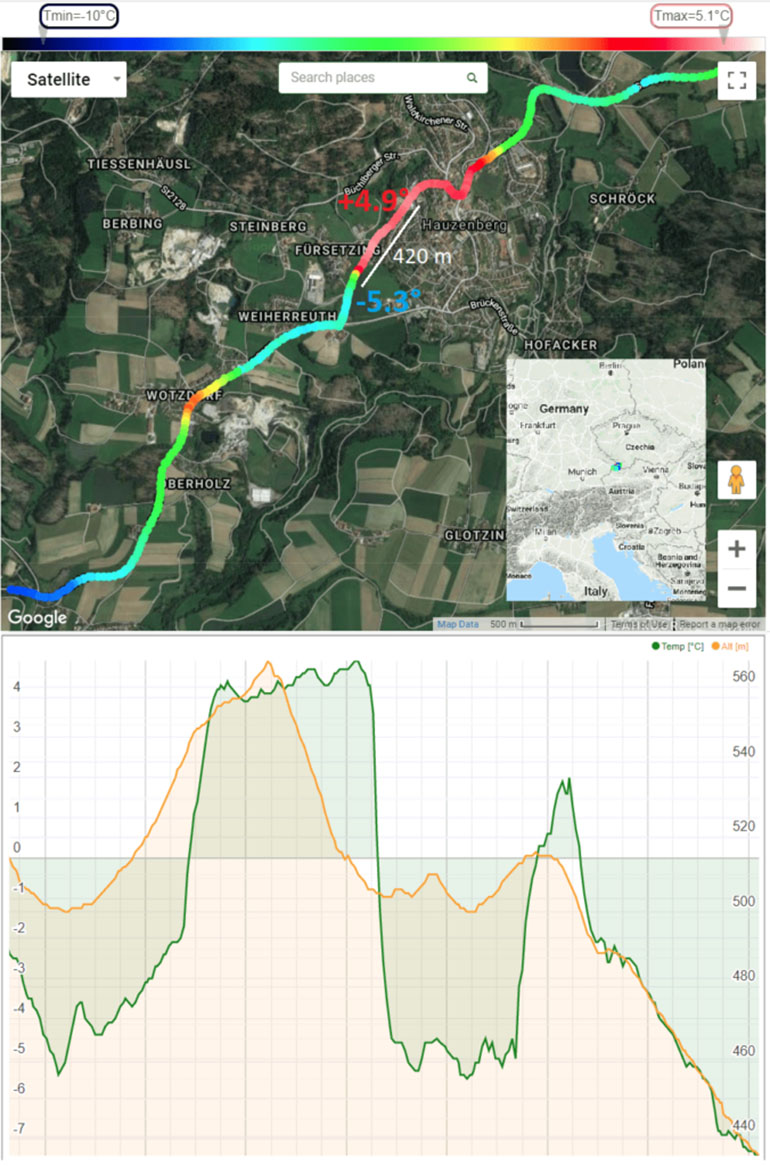
We measured a difference of more than 10 °C between two points in the same village, at a distance of 400 m apart. Temperatures ranged from values well over zero to negative values. For this reason, specifying what the temperature was in Hauzenberg (Germany) during the night between 1st and 2nd January 2020 becomes rather complicated. The correct answer to this question would be all values between 4.9 °C and -5.3 °C.
At a lower latitude and during a different season, we came across some other very interesting data.
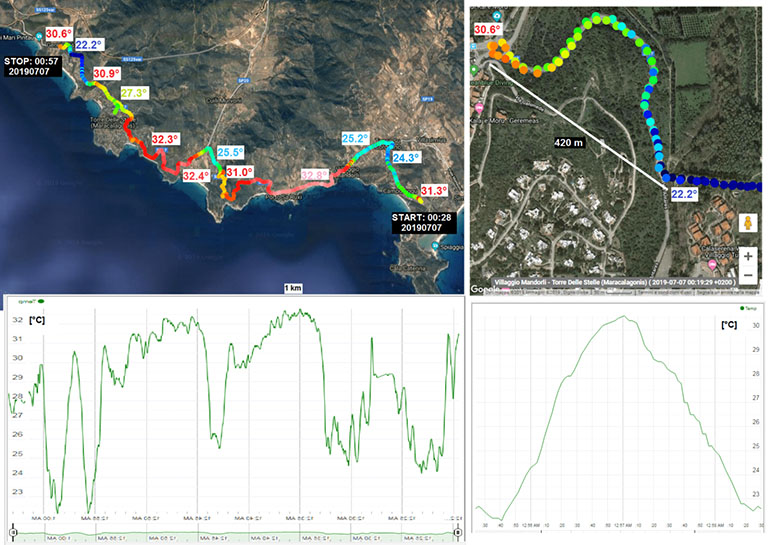
During the night of 7th July 2019, on a coastal stretch covering approximately 20 km in Southeastern Sardinia, we detected thermal variation ranging between 32.8 °C and 22.1 °C whose peak, in terms of rate of spatial variation, was recorded in the location of Geremeas where we measured a difference of 8.5 °C along a 400-meter section of the route (from 30.6 °C to 22.1 °C).
Many other mobile data acquisition sessions, each with their own peculiarities, demonstrate that theextreme spatial variabilityof temperature data does not represent an anomaly at all rather atypical conditionin common meteorological situations.
Aside from conditions of thermal inversion, that in many geographical areas prevail in the cold half of the year (but not only), very pronounced spatial temperature changes can also arise from breezes, interference between mountain ranges and sustained winds (Stau/Föhn), specific elevation profiles, the basic characteristics of the soil, the “urban heat island” effect and other territorial-environmental factors of anthropic origin.
On the one hand, these situations reveal the intrinsic limit of a fixed weather station network, whose information flow, in such cases, is greatly weakened; on the other hand, they highlight the potential and utility of mobile measurements, a source of weather knowledge that has yet to be fully explored and which assumes a significant contingent (item of data in that specific moment, at that specific point) and statistical (climatic characterisation at a high level of spatial resolution) value.
Nowadays, technological advances – from global connectivity to sensor improvements – enable mobile weather exploration by pursuing the vehicle as weather station paradigm, in which a means of transport becomes a mobile weather station through the use of low-cost devices.
But before the measurement system can become mobile, it must satisfy very specific requirements that are by no means a given.
We’ll talk about this in our next post.

0 Comments